In Q3 2022 Wagga Wagga, recorded a median house price of $530,500. This represents annual (Q3 2021 Q3 2022) 17.6% median price growth. That said on a quarter to quarter basis (Q2 2022 Q3 2022), the median house price softened by 0.8%. This is a reflection of interest rate hikes translating into the market. Total house sales decreased annually and quarterly, with Q3 2022 recording the lowest number of sales (265 sales). The unit market recorded an 4.3% median price softening annually, whilst also recording lower amount of sales. Current market conditions create new opportunities for home buyers.


FUTURE DEVELOPMENTS
Wagga Wagga is set to see approximately $1.9B worth of new projects commencing in the 2nd half of 2022


Industrial $6.0M Infrastructure $9.5M Residential $8.7M
Commercial $1.8B
A focus on commercial projects will stimulate economic growth and create new employment opportunities in Wagga Wagga. This will have a positive spill over impact on the real estate market, in the form of higher property demand.

A major commercial project set to commence in the 2nd half of 2022 is the Energy Connect Project ($1.8B). This project will be 900km long, which would run from Robertstown in South Australia to Wagga Wagga in New South Wales.
The industrial market will welcome 63 new industrial subdivision lots ($2.2M) as Byrnes Rd Industrial Subdivision development is planned.
A key residential project planes is 80 Lingiari Drive Residential Subdivision ($2.3M), which plans to add 67 lots. Others include:


• Goonigul Avenue Dwellings (5 dwellings)
• 230 238 Kincaid St Dwellings Maslin Homes (5 dwellings)
• Vincent Rd Subdivision (22 lots)
HOUSE UNIT House Sales
YEAR
YEAR CHANGE FROM LAST House Median Price House Rental Price Unit Sales Unit Median Price Unit Rental Price
OVERVIEW
HALF
MARKET CONDITIONS
HOUSE UNIT
RENTAL MEDIAN PRICE Q3 2022 SALES MEDIAN PRICE Q3 2022
Wagga Wagga Market Update 2nd Half 2022
43 45 $531K $304K $460 $360 19 19 SALES AVERAGE DAYS ON MARKET Q3 2022 RENTAL AVERAGE DAYS ON MARKET Q3 2022
89 Lots
Dwellings
10
MARKET COMPARISON


Average vendor discounts between Q3 2021 and Q3 2022 have widened for both property types, to higher discounts of 2.1% (houses) and 2.3% (units). Market conditions in Wagga Wagga* continue to favour buyers, as vendors are willing to offer below the initial listing price. Q3 2022 average vendor discount is akin to Q2 2021, indicating a possible return to “normal” market.
The suburb of Wagga Wagga has outperformed the wider Wagga Wagga Local Government Area (LGA) in both house and unit median prices for the past 5 years. This is still true for houses, trending to a more premium market. The unit market shows a return to parity, thus new opportunities for buyers.
The dominant proportion of homes sold in Wagga Wagga* in 2022# were in the premium price bracket of above $650,000 (25.2%). Units recorded a dominant affordable price point of $250,000 and less (36.3%). There is almost equal opportunity in the lowest and premium price points for houses, good news for buyers.

PRICE BREAKDOWN

Average vendor discount reflects the average percentage difference between the first list price and final sold price. A lower percentage difference (closer to 0.0%) suggests that buyers are willing to purchase close to the first asking price of a property. UNITS
Less than $349,999 $350,000 to $449,999 $450,000 to $549,999 $550,000 to $649,999 $650,000 and above
Less than $249,999 $250,000 to $299,999 $300,000 to $349,999 $350,000 to $399,999 $400,000 and above
AVERAGE VENDOR DISCOUNT* KEY COMMENTS
HOUSE
SOLD
SOLD
S
The
provides a comparative
for the
past
The main areas profiled are chosen based on their proximity to the main suburb analysed, which
1.8%1.3% 0.1%0.8%1.4%2.1% 2.3%1.0%0.4%0.1%2.1%2.3% -2.5% -2.0% -1.5% -1.0% -0.5% 0.0% Q2 2021 Q3 2021 Q4 2021 Q1 2022 Q2 2022 Q3 2022 Change from Listing to Sale Price House Unit $0
2018
20.9% 19.6% 20.1% 14.3% 25.2%
36.3% 13.2% 15.8% 14.5% 20.1%
2022 #
market comparison graph
trend
median price of houses and units over the
5 years.
is Wagga Wagga.
$100,000 $200,000 $300,000 $400,000 $500,000 $600,000 $700,000
2019 2020 2021 2022# Wagga Wagga House Wagga Wagga LGA House Wagga Wagga Unit Wagga Wagga LGA Unit
RENTAL GROWTH

In September 2022, house rental yields in Wagga Wagga were recorded at 4.1%, higher than Sydney Metro (2.6%). In the 12 months to Q3 2022, median house rental price increased 12.2% to reach $460 per week, whilst the number of rentals declined by 1.9% (to 252). Average days on the market remain low at 19 days. Overall this represents an undersupplied rental market in Wagga, which has a more affordable investment entry price compared to Sydney Metro.

2 bedroom houses have provided investors with +16.1% rental growth annually, achieving a median rent of $360 per week.
Wagga Wagga¥ recorded a vacancy rate of 0.6% in September 2022, which is well below Sydney Metro’s 2.6% average. Vacancy rates in Wagga Wagga¥ have held relatively steady over the past 12 months, remaining within the 1.0% range over the past 18 months. This indicated stability in rental demand and quicker occupancy. These key indicators suggests a conducive environment for investors, particularly with the median house price downturn in the past quarter (Q2 Q3 2022).
RENTAL VACANCY RATES


YIELD
RENTAL
5.0% 5.1% Sydney Metro 4.0% 2.6% Wagga Wagga (2650)¥ Wagga Wagga LGA Sydney Metro 5.1% 4.1% 2022§ 2022 2022€ 2 Bedrooms +12.8% +7.1% 3 Bedrooms 4+ Bedrooms +16.1% 0.0% 0.5% 1.0% 1.5% 2.0% 2.5% 3.0% 3.5% 4.0% 4.5% Sep-19 Dec-19 Mar-20 Jun-20 Sep-20 Dec-20 Mar-21 Jun-21 Sep-21 Dec-21 Mar-22 Jun-22 Sep-22 Wagga Wagga (2650) Wagga Wagga LGA Sydney Metro REIA 'Healthy' Benchmark Wagga Wagga (2650)¥ Wagga Wagga LGA
LEGEND
Industrial Infrastructure
Mixed Use
Commercial Residential
WAGGA WAGGA

Commence Date
1 Project Energyconnect Commercial $1,800,000,000 12/07/2022 2 Cheshire Street Commercial Building Commercial $840,000 19/12/2022 3 Intersales Commercial $850,000 25/08/2022 4 49 51 Moorong Street Commercial Building Commercial $1,192,000 08/12/2022 5 81 83 Forsyth Street Hotel Commercial $2,323,000 30/11/2022 6 Yulong Street Residential Care Facility Commercial $800,000 11/10/2022 7 Kooringal Veterinary Hospital Commercial $3,000,000 08/08/2022 8 Edward Street Health Services Facility Commercial $7,041,000 06/10/2022 9 Rodhams Road Solar Farm Commercial $18,955,000 22/08/2022 10 Byrnes Rd Industrial Subdivision Industrial $2,200,000 17/07/2022 11 7 Dangar Place East Self Storage Facility Industrial $2,200,000 05/12/2022 12 221 Copland Street East Self Storage Units Industrial $1,170,000 26/12/2022 13 Nagle Street East Warehouse Industrial $800,000 12/07/2022 14 Dunns Road Upgrade Phases 2 & 3 Infrastructure $4,300,000 12/12/2022 15 Wagga Wagga City Council Roadworks Infrastructure $950,000 07/11/2022 16 Wagga Wagga City Council Livestock Marketing Centre Sheep Yards Infrastructure $850,000 07/11/2022 17 Vincent Road Residential Subdivision (22 lots) Residential $800,000 05/12/2022 18 Goonigul Avenue Multiple Dwellings (5 dwellings) Residential $1,117,000 05/09/2022 19 80 Lingiari Drive Residential Subdivision (67 lots) Residential $2,345,000 08/12/2022 20 230 238 Kincaid Street Dwellings Maslin Homes (5 dwellings) Residential $1,490,000 24/08/2022
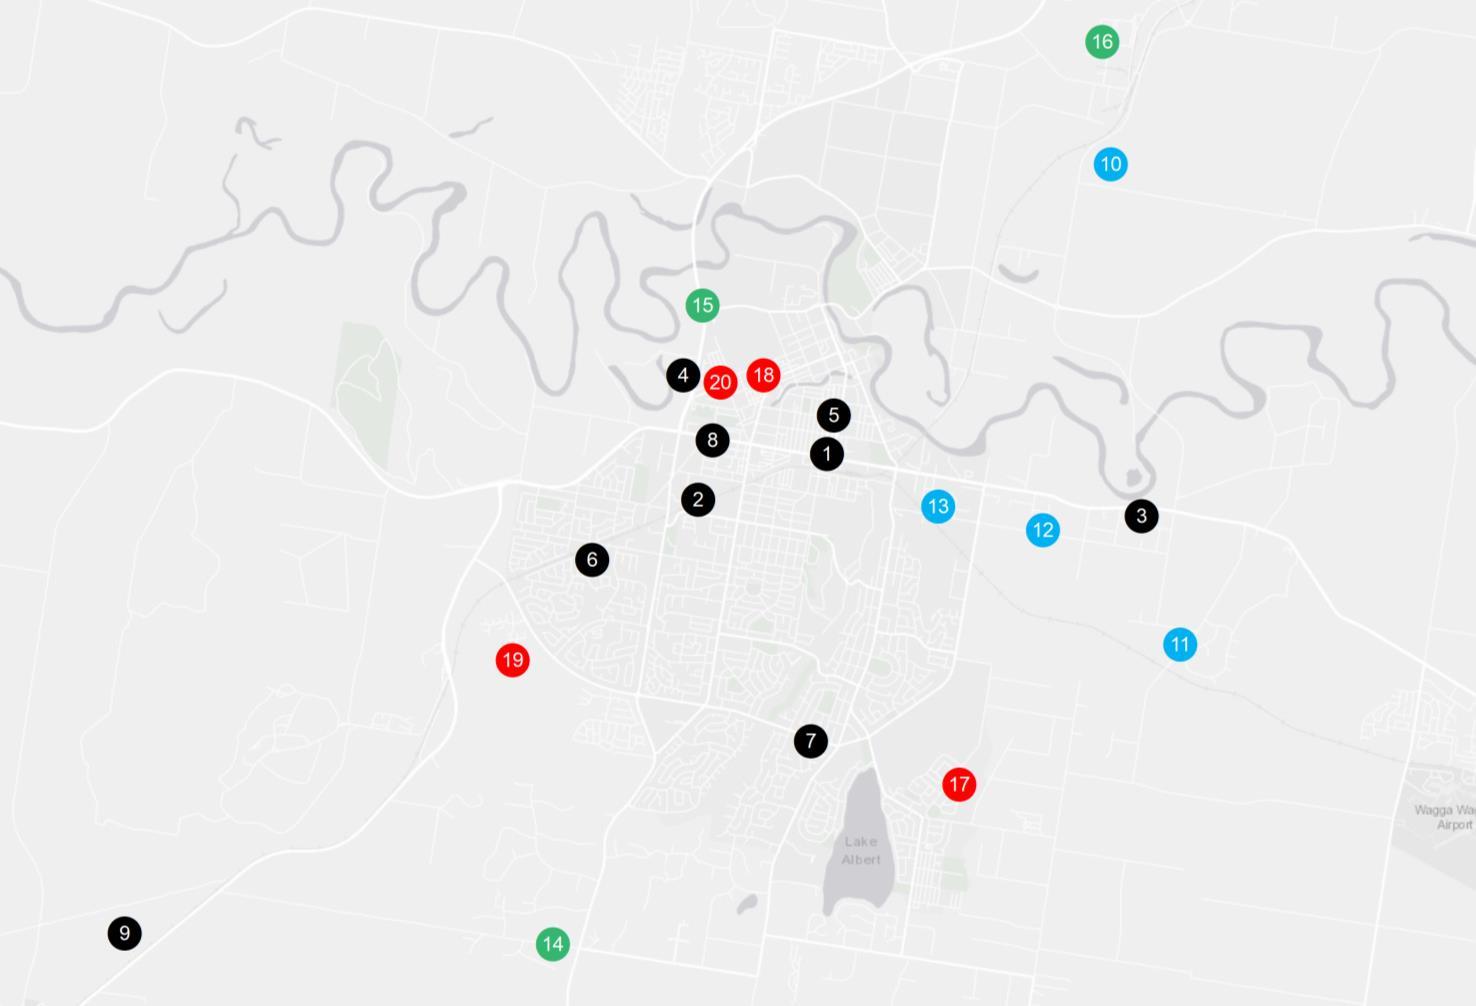
TOP DEVELOPMENTS MAP 2nd HALF 2022₳
Location Project £ Type Estimated Value µ
ψ
•
•
•
•
•
•


OUR SERVICES Our research services span over every suburb,
and state within Australia; captured
of standard and customised products.
PEOPLE Our research team is made up of highly qualified researchers who focus solely on propertyanalysis. OUR KNOWLEDGE Access to accurate and objective research is the foundation of all good property decisions. OUR SERVICES INCLUDE
Advisory and consultancy
LGA,
in a variety
OUR
•
Market analysis including profiling and trends
Primary qualitative and quantitative research
Demographic and target market analysis
Geographic information mapping
Project analysis including product and pricing recommendations
Rental and investment return analysis Simon Freemantle Director M+61 419 987 549 E simonfreemantle@prdwagga.com.au PRD Wagga Wagga P +61 2 6923 3555 F +61 2 6921 4096 53 Fitzmaurice St Wagga Wagga NSW 2650 PRD.com.au/waggawagga
REFERENCES
* Wagga market data and key indicators encapsulates aggregate property market conditions within the Wagga Wagga LGA
** Estimated values are based on construction value provided by the relevant data authority and does not reflect commercial and/or re sale value.
# 2022 encapsulates sales transactions for 2022 (01/01/2022 30/09/2022) only.
€ Annual rental growth is a comparison between 2021 (01/01/2021 30/09/2021) and 2022 (01/01/2022 30/09/2022) house median rent figures.
¥ Wagga Wagga market data encapsulates aggregate property conditions within the postcode of 2650.
§ Rental yields shown are as reported as of September 2022.
₳ Project development map showcases a sample of upcoming projects only, due to accuracy of addresses provided by the data provider for geocoding purposes.
£ Projects refers to the top developments within the suburbs of Wagga Wagga LGA.
µ Estimated value is the value of construction costs provided by relevant data authority, it does not reflect the project’s sale/commercial value.
ψ Commencement date quoted for each project is an approximate only, as provided by the relevant data authority, PRD does not hold any liability to the exact date.
Source: APM Pricefinder, Cordell Connect database, SQM Research, Esri ArcGIS.
Disclaimer: PRD does not give any warranty in relation to the accuracy of the information contained in this report. If you intend to rely upon the information contained herein, you must take note that the information, figures and projections have been provided by various sources and have not been verified by us. We have no belief one way or the other in relation to the accuracy of such information, figures and projections. PRD will not be liable for any loss or damage resulting from any statement, figure, calculation or any other information that you rely upon that is contained in the material.
Prepared by PRD Research. © All medians and volumes are calculated by PRD Research. Use with written permission only. All other responsibilities disclaimed. © Copyright PRD 2022.
